
Gold and silver represent the world’s most recognized precious metals, serving as stores of value, inflation hedges, and safe-haven assets during economic uncertainty. Understanding how these metals price across major global currencies enables informed investment decisions, international trade planning, and portfolio diversification strategies. Current market dynamics show both metals trading near multi-year highs with strong momentum driven by inflation concerns, geopolitical tensions, and robust industrial demand.
Current Gold and Silver Spot Prices (November 15, 2025)
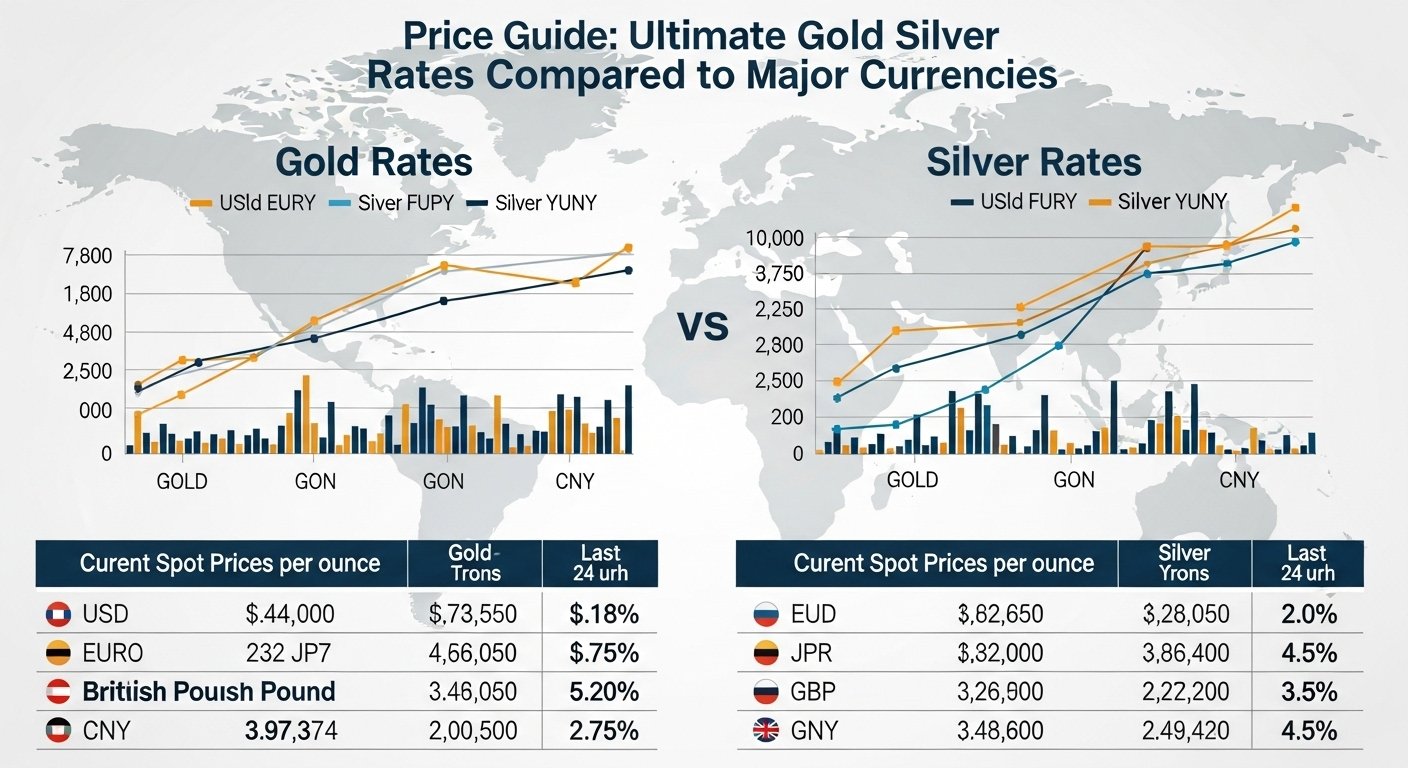
Gold Current Rates:
USD: $4,172.96 per troy ounce
EUR: €3,576.94 per troy ounce
CAD: Approximately $5,720 per troy ounce (calculated)
GBP: Approximately £3,200 per troy ounce (calculated)
Silver Current Rates:
USD: $50.47 per troy ounce
EUR: Approximately €46.50 per troy ounce (calculated)
CAD: $71.07 per troy ounce
GBP: Approximately £38.50 per troy ounce (calculated)
Gold-Silver Ratio:
Current Ratio: 81.59:1 (as of November 11, 2025)
Historical Average: 60:1 to 75:1
Current Status: Above historical norms, suggesting silver may be undervalued relative to gold
Understanding Precious Metal Pricing
What Determines Gold and Silver Prices
Precious metal pricing reflects complex interactions between supply dynamics, demand patterns, currency movements, interest rates, inflation expectations, and geopolitical developments. Unlike fiat currencies backed by government promises, gold and silver possess intrinsic value through physical scarcity and industrial utility.
Supply Factors:
Primary gold production totals approximately 3,000 tons annually from major producers including China, Australia, Russia, and the United States. Silver production reaches roughly 25,000 tons yearly, with approximately 70% derived as byproducts from copper, lead, and zinc mining operations. This supply concentration creates production constraints affecting price responsiveness to demand changes.
Demand Components:
Gold demand separates into investment demand (40-45%), jewelry demand (40-45%), central bank purchases (10-15%), and industrial/technology applications (8-10%). Silver demand splits differently—industrial uses consume 50-55% of supply, with investment demand comprising 25-30%, jewelry using 10-15%, and silverware/other applications accounting for the remainder.
Currency Relationship Impact:
Precious metals price are primarily quoted in US Dollars globally, creating inverse relationships between dollar strength and metal prices. When the dollar weakens, gold and silver typically appreciate in dollar terms. Conversely, dollar strengthening often coincides with metal price declines. This relationship means European and Asian investors experience different effective prices depending on their local currency strength versus the dollar.
Gold Price Analysis Across Major Currencies
USD-Denominated Gold Pricing
Gold reached $4,172.96 per troy ounce as of November 13, 2025, trading near all-time highs after breaking through the psychological $4,000 barrier earlier in the year. The recent peak touched $4,380 per ounce before modest profit-taking drove temporary consolidation between $4,100 and $4,250.
Year-to-date performance shows gold appreciating approximately 4-6% in dollar terms despite periodic volatility. The November trading range between $4,000 and $4,250 reflects ongoing bull-bear battles as buyers accumulate dips while profit-takers sell rallies.
EUR-Denominated Gold Pricing
European investors experienced gold appreciation to approximately €3,576.94 per troy ounce by November 12, 2025. This represents substantial gains from January 2025 levels near €2,440 per ounce—approximately 46% appreciation in euro terms over the year.
The stronger euro performance relative to dollar gains reflects euro weakness against the dollar throughout 2025. European investors benefited from both underlying gold price increases plus additional currency translation gains as their euros purchased fewer dollars, requiring more euros per dollar-priced ounce.
Multi-Currency Perspective
Different currency perspectives create varying investment returns for international precious metals investors. Canadian investors saw gold reach approximately CAD $5,720 per ounce by mid-November, while British investors witnessed prices near £3,200 per ounce. These variations reflect exchange rate movements between respective currencies and the US Dollar.
Silver Price Analysis Across Major Currencies
USD-Denominated Silver Pricing
Silver traded at $50.47 per troy ounce as of November 13, 2025, representing extraordinary gains from sub-$30 levels earlier in the year. Recent volatility saw silver briefly surpass $54 per ounce before consolidating in the $48-$52 range through mid-November.
Year-to-date silver performance dramatically outpaces gold, with gains exceeding 50% by most measurements, and some period calculations showing 85% appreciation depending on starting reference points. This explosive performance reflects growing industrial demand, particularly from solar panel manufacturing and electric vehicle production, alongside robust investment inflows.
EUR and CAD-Denominated Silver
European silver investors experienced similar amplified gains as euro weakness against the dollar compounded underlying silver price appreciation. Canadian investors saw silver reach CAD $71.07 per troy ounce, representing substantial gains from earlier 2025 levels near CAD $42 per ounce.
The Gold-Silver Ratio Explained
Current Ratio Analysis
The gold-silver ratio currently stands at 81.59:1 as of November 11, 2025, meaning one ounce of gold purchases 81.59 ounces of silver. This ratio declined from peaks above 107:1 in April 2025 but remains elevated compared to long-term historical averages between 60:1 and 75:1.
Calculating the Ratio
Simply divide the current gold price by the silver price:
Formula: Gold Price ÷ Silver Price = Gold-Silver Ratio
Using November 2025 prices:
Gold: $4,172.96 per ounce
Silver: $50.47 per ounce
Calculation: $4,172.96 ÷ $50.47 = 82.67:1
Historical Context
The ratio exhibits substantial volatility across economic cycles. March 2020 witnessed the ratio explode to 125:1 during the COVID-19 panic as gold surged while silver markets experienced severe disruptions. Throughout the 1900s, the ratio averaged between 50:1 and 60:1, while recent decades suggest a normalized range near 60:1 to 75:1.
Investment Implications
The current 81:1+ ratio sits above historical norms, suggesting silver appears relatively undervalued compared to gold. This positioning attracts value-focused precious metals investors who believe mean reversion will compress the ratio through silver outperformance. Historical patterns show silver tends to outperform gold during later stages of precious metals bull markets.
2025-2026 Price Forecasts
Gold Outlook
Conservative forecasts project gold trading between $3,900 and $4,400 per ounce through late 2025 and early 2026. Optimistic scenarios envision continuation toward $4,500-$4,800 if inflation concerns intensify or geopolitical risks escalate. Bearish scenarios suggest potential pullbacks toward $3,600-$3,800 if Federal Reserve policy tightens unexpectedly or economic growth accelerates, reducing safe-haven demand.
Key factors supporting higher gold prices include central bank accumulation continuing at elevated levels, persistent inflation concerns despite moderating headline rates, ongoing geopolitical tensions, and potential dollar weakness as interest rate cuts proceed.
Silver Forecast
Heraeus Precious Metals expects silver trading within $28 to $40 per ounce, though current prices already exceed this forecast range, suggesting potential upward revision. More optimistic analysts project silver reaching $55-$65 per ounce if industrial demand accelerates and investment flows maintain momentum.
Silver’s 2024-2025 rally brought substantial investor attention back to the metal. Once momentum builds in silver markets, it tends to feed on itself as performance attracts additional buyers. Industrial demand growth, particularly from solar panel manufacturing expanding rapidly, provides fundamental price support beyond purely investment-driven demand.
Ratio Forecast
Conservative projections anticipate the gold-silver ratio drifting down to 75:1 by late 2026 through gradual normalization. Base case scenarios envision compression to 70:1 as industrial silver demand strengthens. Optimistic outcomes compress the ratio to 65:1 or below if silver experiences another surge comparable to 2024-2025 performance.
Factors Driving Current Precious Metals Prices
Inflation and Currency Debasement
Despite moderating from 2022-2023 peaks, inflation remains above central bank targets across most developed economies. Gold and silver function as inflation hedges, preserving purchasing power as fiat currencies depreciate. MENA region inflation forecasts project easing to approximately 3-4% by 2026, though uncertainty remains elevated.
Central Bank Accumulation
Central banks, particularly in emerging markets, continued aggressive gold purchases throughout 2024 and 2025. This institutional demand provides structural price support independent of speculative investment flows. Central banks accumulated gold at near-record rates, diversifying reserves away from dollar-denominated assets.
Industrial Silver Demand
Silver industrial consumption accelerated dramatically through 2024-2025, driven primarily by solar photovoltaic panel manufacturing expanding to meet renewable energy targets globally. Each solar panel requires approximately 20 grams of silver, with worldwide solar installations growing 30-40% annually, creating persistent supply deficits.
Electric vehicle production growth adds supplementary demand as vehicles utilize silver in electronics, batteries, and electrical connections. Combined industrial demand growth substantially exceeded new mine supply, driving price appreciation.
Geopolitical Uncertainty
Ongoing geopolitical tension, including regional conflicts, trade policy uncertainties, and strategic competition between major powers, drives safe-haven demand toward precious metals. Gold particularly benefits from crisis-driven allocations as investors seek assets independent of government policy or geopolitical outcomes.
Interest Rate Environment
Federal Reserve rate cuts throughout 2025 reduced the opportunity costs of holding non-yielding assets like gold and silver. Lower interest rates make precious metals relatively more attractive compared to interest-bearing alternatives, supporting prices through increased investment demand.
Investment Strategies and Considerations
Strategic Allocation Recommendations
Based on the current 81:1 gold-silver ratio positioning above historical averages, some precious metals strategists suggest overweighting silver relative to gold in portfolio allocations:
Above 85:1 ratio: 70% silver, 30% gold
75:1 to 85:1 ratio: 60% silver, 40% gold
65:1 to 75:1 ratio: 50% silver, 50% gold
Below 65:1 ratio: 40% silver, 60% gold
These tactical allocations aim to benefit from potential mean reversion, compressing the ratio through silver outperformance.
Currency Diversification Benefits
International investors benefit from holding precious metals as currency-neutral assets. Europeans holding physical gold in euros experienced amplified gains through 2025 as euro weakness compounded dollar-denominated price appreciation. This currency translation benefit provides additional diversification value beyond metal price movements alone.
Physical Versus Paper Exposure
Investors choose between physical bullion ownership, exchange-traded funds (ETFs), mining company shares, and futures contracts. Physical ownership provides direct metal exposure without counterparty risk but involves storage costs and liquidity constraints. ETFs offer convenient exposure with lower transaction costs but introduce counterparty and management fee considerations.
Conclusion
Gold and silver continue demonstrating strength across major currencies as multiple supportive factors converge. Gold reached $4,172.96 per troy ounce while silver surged to $50.47 per ounce by mid-November 2025, both trading near multi-year highs. The 81.59:1 gold-silver ratio sits above historical norms between 60:1 and 75:1, suggesting silver may offer relative value compared to gold.
European investors experienced amplified precious metals gains through 2025 as euro weakness compounded dollar-denominated price appreciation. Gold reached approximately €3,577 per ounce while silver traded near €46.50 per ounce, representing substantial year-over-year gains.
Looking forward through 2026, multiple analysts forecast continued strength supported by persistent inflation concerns, central bank accumulation, industrial silver demand growth, and geopolitical uncertainties. Gold should trade between $3,900 and $4,500 per ounce, while silver potentially reaches $55-$65 per ounce if industrial demand and investment flows maintain momentum.
Strategic precious metals allocation provides inflation protection, currency diversification, and safe-haven characteristics within balanced investment portfolios. Current market positioning suggests tactical overweighting toward silver relative to gold may benefit from potential ratio compression through mean reversion toward historical norms.